I remember the time when I first heard the term Profiling, I could barely write source code without googling every 10 minutes at that time and when I heard about profiling, I couldn’t help but tell myself that I will never be able to master programming! Then after a few years I became very comfortable with programming, I came across the term again, but this time I was not scared anymore! So went out and did some research about it and what I found out was shocking, the concept of profiling was not so difficult, it was just another technical concept with a cool name to discourage beginners from ever looking it up!
What is Profiling? Profiling is a process to help determine which part of the source code is running often and how long it takes for a single run so that optimizations can be done on that particular part of code to give the entire applications some performance benefits.
In this article, I am going to try and explain the above 2 line definition using 2 different methods to do it on embedded source code using some examples. I hope by the end of the article you too will feel the same way as I did and go out with the feeling that profiling is very simple after all! So let’s begin!
Profiling
To find out which part of code is running often we need some data about the dynamic behavior of our code. By “dynamic behavior” I mean the behavior of the code as it runs. This needs to be done in a non-intrusive manner so that it does not affect the actual functioning of the system. In other words, the profiling process should not change the behavior of the code too much so that the data collected is actually valid and useful.
Thus data is collected by letting our embedded software run for a certain duration of time and collecting some data about it as it runs. Once the data is collected, all that we need to do is sit and analyze the data and figure out how to improve our embedded source code so that we can optimize it to run in a shorter duration.
Optimization is not the only use of profiling, it can be also useful
- To figure out in what order the interrupts are happening
- To figure out how the scheduler is switching between tasks (in case of embedded systems with an OS like the FreeRTOS).
- To figure out the time it takes for an event to be handled, in order to verify if the time constraints are met.
This sort of data can be extremely useful while debugging some difficult bugs.
The data needed for analysis can be collected in 2 ways
- Through a software dump
- Through available hardware.
Let’s see both these methods of data collection in detail along with some examples.
Collecting Software Dump
This method involves just collecting some data to an array for a certain period of time and then once the array is full, we can halt the code and analyze the data collected. Let’s see what kind of data can be collected through this method and how that can help us profile our code through an example.
Let’s say our example source code contains 3 functions, let’s name them function1, function2, and function3 to keep things simple. All these functions are Interrupt Service Routines and are connected to buttons 1, 2 and 3 respectively.
In other words, once button1 is pressed, it calls function1, pressing button2 calls function2 and pressing button3 calls function3.
You can have a look at the pseudo-code below.
int function_number;
int time;
int time_data[500];
int func_data[500];
int i;

void stop_execution()
{
    // Disable all interrupts and halt the code
    // So that we can take the data in the array and analyse it
}

void profiling_function(int func_no)
{
    time_data[i] = get_system_time();
    func_data[i] = func_no;
    i++;
    if (i == 500) {
        stop_execution();
    }
}

void function1()
{
    profiling_function(1);
    .
    .
    .
}

void function2()
{
    profiling_function(2);
    .
    .
    .
}
void function3()
{
    profiling_function(3);
    .
    .
    .
}


void set_up_interrupts()
{
    setup_interrupt(BUTTON1, function1);
    setup_interrupt(BUTTON2, function2);
    setup_interrupt(BUTTON3, function3);
}

void main()
{
    set_up_interrupts();
    while(1)
    {
        sleep_ms(10);
    }
}
The main function simply sets up the interrupts and sleeps. Once a button is pressed, the respective function is called. In the 1st line of each function, we have made a call to our profiling_function() so that it can take the function number and the system time and put it in 2 arrays.
Take a moment to look at the code so that you can get a feeling of how this data is collected.
This code is handed out to the user for testing. As the user goes through his normal routine, our profiler function gathers the data and once the number of data points collected reaches 500, the program is halted so that we can take a look at the data collected. This data can either be printed out or stored in the flash memory so that we can analyze it later.
Take a look at the table below.
| Function | number of times called |
| 1 | 150 |
| 2 | 300 |
| 3 | 50 |
Let’s assume this is the result of our data collection experiment. Now as we can see the function2 has been called 300 times (or 60% of the time), so its the frequently called function and hence it is our primary candidate for optimizations.
Function3, on the other hand, was only 50 times (or 10% of the time), so we can keep it for later.
Calculating the time taken by each function
This can be calculated using the system time information that we have collected using the time_data array. All we need to do here is add one more line to each function at the end to call the profiling function again as in the code below.
void function1()
{
    profiling_function(1);
    .
    .
    .
    profiling_function(1);
}
Now our collected data will be something like this
| Time (in clock ticks) | Activity |
| 156 | function1 started |
| 271 | function 1 exited |
Here the execution time in clock ticks is 271-156 = 125. Assuming that the processor runs at 1MHz, 1 tick = 1 microsecond, so it took 125 microseconds to run this function.
Limitations of Software Dump method
The main limitation comes from the fact that the software dump method is “intrusive” to a certain degree.
Since we added a line of code to every function it can consume a lot of processor’s time, as a result, it is extending the time taken to execute each ISR. Hence it has the potential to change the runtime behavior of our program.
Another problem is the fact that only limited data can be collected as in embedded product development we will be working with limited memory. For example, if our system only has 10kB of free memory on-board then that’s all the data we can collect.
This is perfectly fine if your system does not have any time constraints and you need limited data from a limited duration. If it does have time constraints or need to extended info then it is better to use less intrusive methods like the hardware profiling that is explained in the next section.
Hardware Profiling
In this method, what we do is simply let use a GPIO pin to give us a pulse as the execution enters and leaves a function.
Take a look at the pseudocode below.
void function1()
{
    turn_on(GPIO1)
    .
    .
    .
    turn_off(GPIO1)
}

void function2()
{
    turn_on(GPIO2)
    .
    .
    .
    turn_off(GPIO2)
}

void function3()
{
    turn_on(GPIO3)
    .
    .
    .
    turn_off(GPIO3)
}


void set_up_interrupts()
{
    setup_interrupt(BUTTON1, function1);
    setup_interrupt(BUTTON2, function2);
    setup_interrupt(BUTTON3, function3);
}

void main()
{
    set_up_interrupts();
    while(1)
    {
        sleep_ms(10);
    }
}
Here we have completely removed the profiling functions and added some code to turn-on/ turn-off particular GPIOs instead.
In our example, once we press button1 the function1 is called and here as we enter the function GPIO1 is turned ON and as we leave the function GPIO1 is turned off. Similarly, GPIOs 2 and 3 are used for functions 2 and 3 respectively.
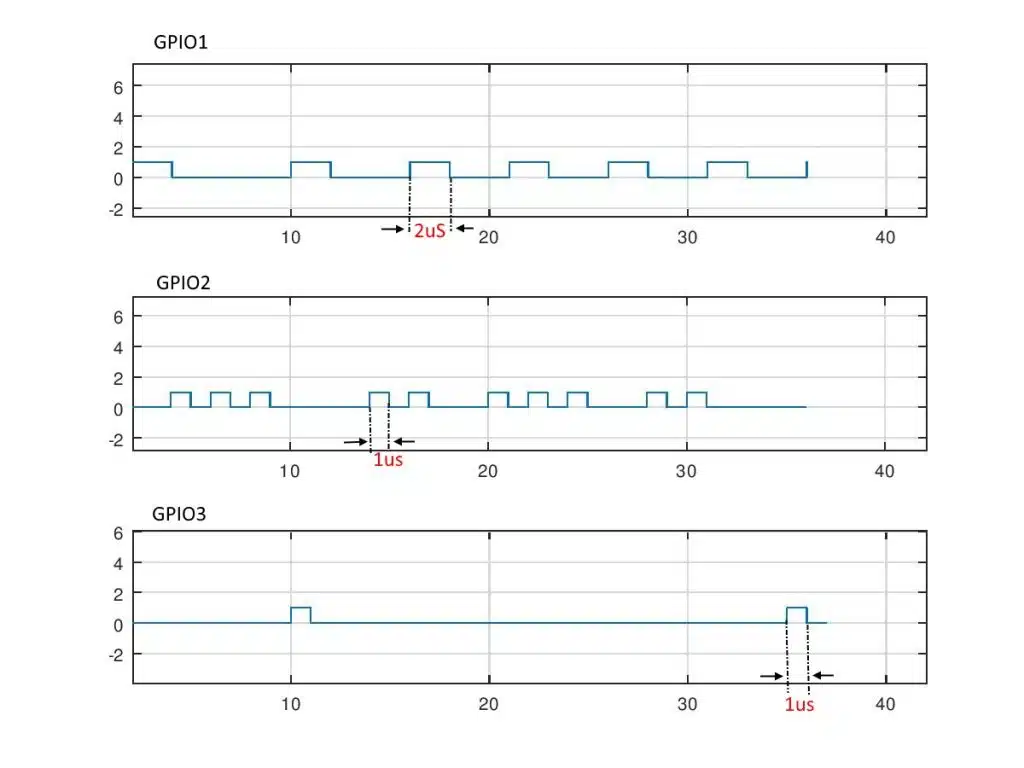
Now to collect the data all we need to do is simply connect the GPIOs to a multi-channel oscilloscope or a logic analyzer and we can see visually how frequently a function is being called.
By doing this not only can we know the frequency of the functions, but also the time it takes for each function to execute, all without wasting much memory and processor time.
This is much less intrusive as usually, it will not take more than 3 to 5 processor cycles in most processor architectures to turn on and turn off simple GPIOs. (as compared to 10-20 cycles it can take to collect a single data point in the software dump method.)
Take a look at the figure below showing an example result of such data collection process

Here the GPIO1 is turned on and off 5 times and GPIO2 has 10 pulses and GPIO3 has just 2 pulses. Also, the time period of GPIO1’s pulse is 2microseconds, GPIO2 is 1microsecond2 and GPIO3 is 1microseconds.
So using this information we can come to the conclusion that function2 is the most frequently called one. But in terms of CPU time both function1 and function2 occupy 10microseconds each. So they are both good candidates to be optimized.
Reasons for doing Profiling
You may be thinking, there are just 3 functions, why not optimize all three of them? What is the need for even doing this profiling process?
The answer to that question is real-world applications often have 100s of functions and optimizing each one of them can take years of developer’s time. Let’s take a look at 2 reasons why we go through this process of profiling.
Reason #1: The 80/20 rule
This rule is simple, in the software engineering world, 80% of the processor’s time will be consumed by only 20% of the functions. So assuming we have 100 functions, by just optimizing 20 of those, we can make performance gains of over 80%. This is the reason we choose to profile our code before we start the optimization process.
Reason #2: Optimization is hard!
This is another reason do limit the optimizations as much as possible. Optimizations have a high probability of breaking perfectly working code as complex software is usually like a house of cards such that if one piece is misaligned the entire system could crash!
Usually, optimization is done by either correcting the algorithms and logics used to build a certain feature or by changing the source code to use in-line assembly. This process is time-consuming and a difficult one to do.
Hence it’s a good idea to limit optimizations to the minimum possible amount!
Okay, I will stop here, I hope you have got some value from this article!
You can email us or contact us through this link if you have any questions or suggestions.
If you liked the post, feel free to share this post with your friends and colleagues!
References
Embedded Systems-Introduction to ARM CortexM Microcontrollers by Jonathan Valvano (link to Amazon)

